With the release of Tableau 2018.2, the extensions API has already made a big splash with all of its fantastic new capability. Check out the Tableau extensions gallery to get a glimpse of a few of the awesome applications that have already been created. However, the real intention of this feature is give our community even further flexibility in what they can do with the Tableau Dashboard. And with great power, comes great learning opportunity. This post is designed to give you the ability see first-hand how you design, build and publish an extension of your own, so that YOU can also help build amazing extension for the Tableau community.
Initialization
Stand up a VM that can be made accessible by the public internet. These days it is extremely efficient and inexpensive to have web server in the cloud. In this tutorial I will be using a google cloud Compute Instance but you can use anything you want, AWS, Azure or even a VM in your own apartment (as long as you make it public). I will doing a part 2 on creating a server less architecture of this application with Google cloud in the future.
Step 1- Build a simple flask application
Flask is a great web framework that enables your python code to act as web pages. By doing this you can effectively run Python code on data that you’ve requested as part of an Ajax call or other API call. I will quickly walk through building a simple Flask application.
The first thing to do once you’ve set up your VM is to install flask:
PIP install flask
Next, you’ll most likely have a few dependencies packages that need to get installed as well. In my case, I was requiring. A great way to do this is to create a requirements file that installs all of your applications dependencies quickly and efficiently. For this application we need certain python libraries such as alpha_vantage, pandas, and numpy. Here is an example of what my requirements.txt looks like:
Flask==1.0.2
google-cloud-datastore==1.4.0
google-cloud-storage==1.7.0
google-cloud-logging==1.4.0
google-cloud-error_reporting==0.29.0
gunicorn==19.7.1
oauth2client==4.1.2
Flask-SQLAlchemy==2.3.2
PyMySQL==0.8.0
Flask-PyMongo==0.5.1
PyMongo==3.6.0
six==1.11.0
requests[security]==2.18.4
honcho==1.0.1
psq==0.7.0
alpha-vantage==2.1.0
psycopg2==2.7.5
pandas==0.23.4
tinynumpy==1.2.1
|
you can install these like so:
pip install -r requirements.txt
Then you are ready to write your initial flask application. Mine looks something like this:
from flask import Flask, render_template, request, jsonify

from Get_Data import get_data, build_connection, run_sql

import random

import string

from OpenSSL import SSL
#First, create a flask class object we use to run our program

app = Flask(__name__)
##This section defiles my SSL certs so that I correctlty can run HTTPS on my site.
context = SSL.Context(SSL.SSLv23_METHOD)

cer = 'fireanalytics-dev.crt'

key = 'testcert.key'
#set the route to the first place you go. So when I go to the site http://0.0.0.0:500 I will render my Index.html template

@app.route('/')

def index():

return render_template('Index.html')
### This is another page in my web application. it will get used when some clicks the button in my application.
@app.route('/_add_numbers')

def add_numbers():

a = request.args.get('a', 0, type=str)

hashvalue = ''.join(random.choice(string.ascii_uppercase + string.digits) for _ in range(6))

#r = test_1()

#print r

data = get_data(a, hashvalue)

data = [tuple(x) for x in data.to_records(index=True)]

cur, conn = build_connection();

run_sql(cur, conn, data);

print jsonify(result=hashvalue)

return jsonify(result=hashvalue)
if __name__=="__main__":

context = (cer,key)

app.run(host='0.0.0.0', port=5000, ssl_context=context)

# app.run()

# app.run(host='0.0.0.0', port=5000)
Now you have the basic framework of the application, and now we’ll need to implement the HTML and JavaScript to our application and user interface. Flask will look for template files when we call the Render template function as we do in return render_template(‘Index.html’) So you will need to place this in a templates directory in the application folder(see flask documentation for this: http://flask.pocoo.org/docs/1.0/quickstart/.
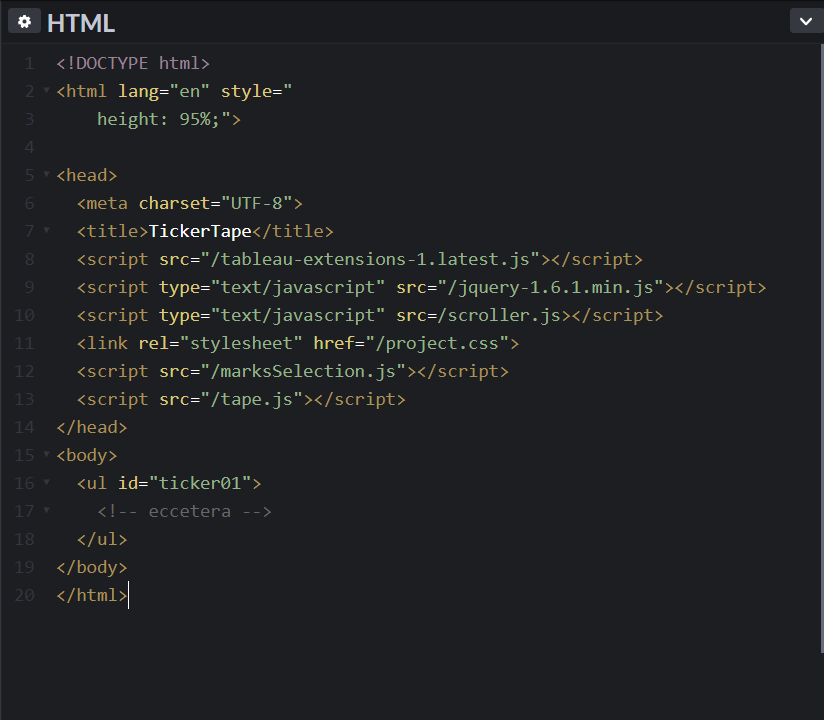
Here is what our Index.html file looks like. It will be first place to render your extension.
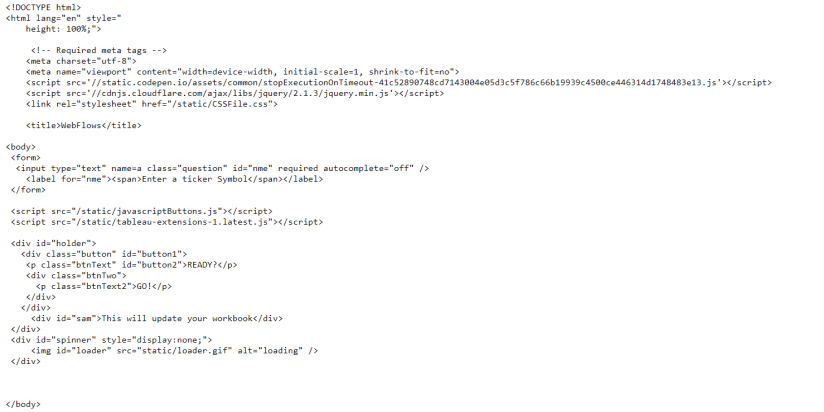
Here you’ll notice a few things. We are using sources from both javascriptButtons.js and tableau-extensions-1.latest.js. The first is a custom .js file that has the logic of what to do when a button gets pushed. The second, is the extensions library that allows us to interact with the objects in the dashboard. Tableau has done a fantastic job with explaining how this all works here:
https://tableau.github.io/extensions-api/docs/index.html
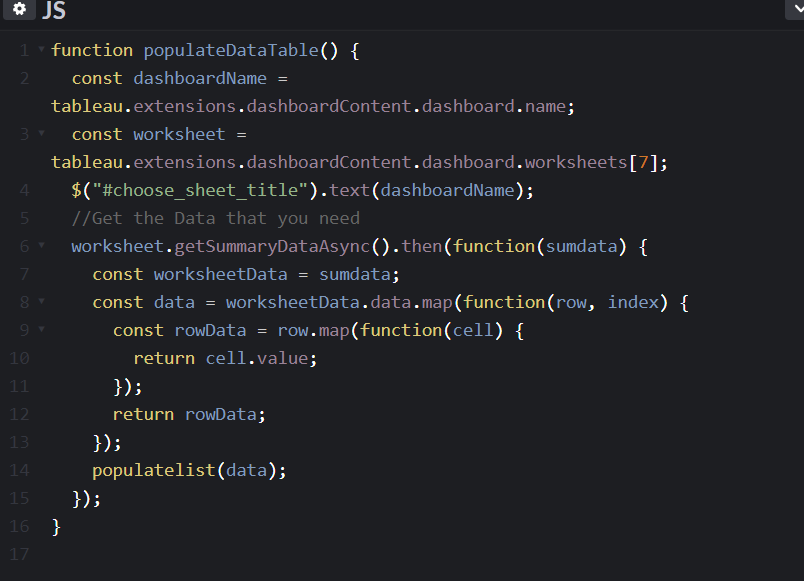
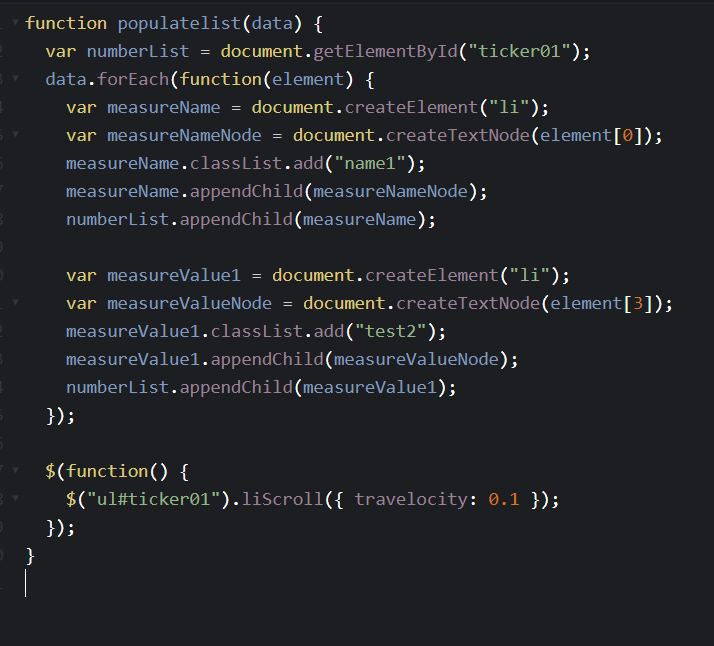
To see what our custom .js file does in specific, take a look at this:
// load the page first. We need to wait for the entire page to load first then we can start to interact with it.
window.onload = function() {
// load tableau extension
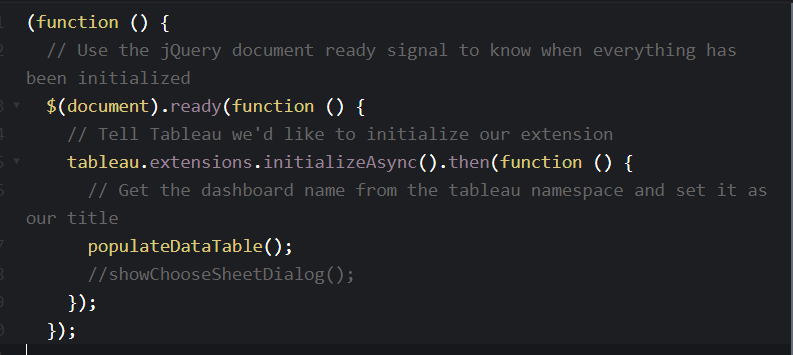
tableau.extensions.initializeAsync()
//Get the button
var button = document.getElementById('button1')
// 2. Append somewhere
var body = document.getElementsByTagName("body")[0];
body.appendChild(button);
// 3. Add event handler
button.addEventListener ("click", function() {
// Do some visual FX things to wait for things to load up.
$('#spinner').show();
$('#sam').hide();
//get request to page where python is located//

$.getJSON('http://localhost:5000/_add_numbers', {

// Gets the inputted value

a: $('input[name="a"]').val()

}, function(data) {

// If succesful executes these commands

$('#spinner').hide();

$("#sam").text(data.result);

const param = tableau.extensions.dashboardContent.dashboard.getParametersAsync().then (function (sum) {

const sam = sum[0].changeValueAsync(data.result)

});

// show the value at this piont in the juncture

$('#sam').show();

});

return false;

});

}
So as you can see, there are three primary components to our extension. We have:
1. A flask application(written in python) that directs us to certain pages
2. We have an HTML file that displays our application
3. We have a JS file allows us to interact with the HTML.
Step 2 Build the components of the extensions API necessary
Tableau’s extension API is a wonderful way to embed flexibility into your dashboards that once was never even possible. Tableau’s Extension API uses a JavaScript Library to get gain access to the dashboard’s object model then perform actions on these objects. The feature is very well documented here and this tutorial touch a small part of the overall capability.
You should have noticed in the javascriptButtons file that there were a few places were the extensions API was used. They were:
// load tableau extension

tableau.extensions.initializeAsync()
AND
const param = tableau.extensions.dashboardContent.dashboard.getParametersAsync().then (function (sum) {

const sam = sum[0].changeValueAsync(data.result)
The first initializes our code to let it know that we’d like to utilize the extensions API attributes. This will ALWAYS need to be there in any extensions API application you develop. The second piece, simply looks at which parameter is present in the dashboard and then changes the value. You can see the details on the documentation that’s linked above.
Step 3 Enable for SSL
The extension API requires a very secure environment. This means that in order to host your extension somewhere you need to run your entire application over HTTPS. To do this you’ll need to get an SSL certificate to authorize your domain to run over HTTPS. SSL is means to encrypt all of the traffic running from your dashboard to extensions. It’s important to keep your data safe even when your extension is hosted inside your firewall.
Here are the steps I took to get my SSL working on my VM.
- Create s CSR and private key using openSSL. Make sure to use the FQDN that the internet recognizes is your computer.
- Send this CSR to CA like go daddy, comodo or something else. You can potentially do this for free.
- They will send you back a .CRT file you can use to have the public internet trust your server. This way you can use HTTPS as people access your server.
- Finally, when you start your web server make sure to include your newly gotten .CRT file and the private key you initially created in step 1.
I will demonstrate how it this was done in our application. All we do is bind these .CRT and .key files when we start our webserver. Flask will automatically recognize this as HTTPS:
from OpenSSL import SSL ##we make sure to import the necessary Library

context = SSL.Context(SSL.SSLv23_METHOD) # we initialize the context

cer = 'fireanalytics-dev.crt' # we point to where our .crt file is located

key = 'testcert.key' #we point to where our .key file is located
Then, we need to feed these as options when we start the web server, like this:
if __name__=="__main__":

context = (cer,key)

app.run(host='0.0.0.0', port=5000, ssl_context=context)
Step 4 Build the rest of the application
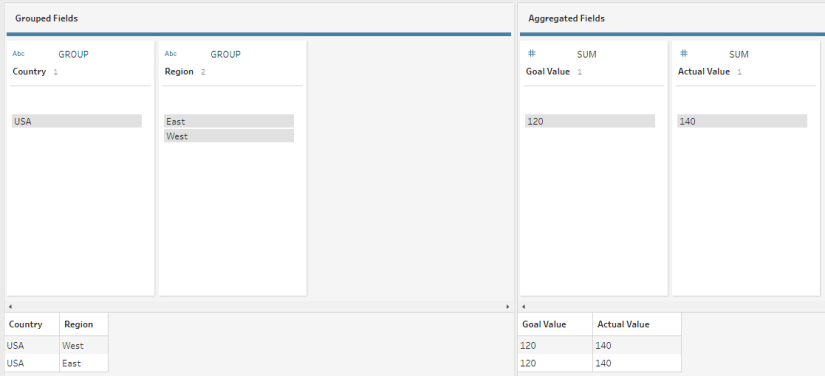
At this point you have been given the main components necessary to host your application online. The rest of our application will do the following:
1. Make a call to an API to get data
2. Transform the data how we’d like it.
3. Update the database to reflect new API call data
4. Pass a token into the database that makes those records unique.
5. Update the parameter to only view those records that we want.
You can get the entire application here at GITHUB if you’re interested!
Step 5 Test it out!
- Go to GITHUB and download the application files. Since you’ll be running it locally, you won’t need SSL for this extension.
- Update the necessary areas of the code for your environment.
- Start your web server by something like >> python myflask.py
- Use the .trex in your workbook. (Make sure that the .trex file points to your web server so it render the page correctly!
It has been please learning all of this information and I hope you find this walk-through useful to you.
Until next time!